Introduction
The year is off to a tremendous start across both our investment strategies. Visible signs of the transformation of our energy, transportation, technology and other sectors are everywhere. The last four years have brought astonishing growth in areas like installed solar and wind capacity, the number of EVs sold, the amount of renewable natural gas produced and the demand for copper and other raw materials needed to make it happen. Nat Bullard, of Bloomberg NEF, has been publishing an annual review of clean energy and related sectors for many years now. He recently published his 2023 slide deck, and we will highlight a few of them in our intro.
Last year, more than $1.7 trillion globally was invested in support of energy transition in things like EV charging infrastructure, renewable power installations, transmission lines, energy storage systems, smart grid technology, biofuels and energy saving technology in homes, businesses, manufacturing facilities and data centers.
$1.8 Trillion for Energy Transition
Global energy transition topped $1.7 trillion in 2023, including grids
$2.0 trillion of global energy transition investment
![]()
Source: Nat Bullard, Bloomberg NEF
Energy storage installations tripled in 2023 to almost 100 GWh worldwide. Experts are predicting 2024 will be even higher due to improving economies of scale for battery production, falling costs for raw materials such as lithium, technological advancement in battery chemistry, strong demand from electric utilities for peak-load management and grid stabilization, government incentives and of course the growing need to store renewable power when generated so it can be dispatched at other hours of the day. According to EnergyTrend, China is expected to lead the way for installations in 2024 with 55 GWh of new capacity, followed by the USA with 43 GWh.
Energy Storage Installations Tripled
Battery installations tripled from 2022 to 2023, with forecasts revised significantly upward
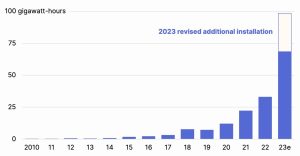
Source: Nat Bullard, Bloomberg NEF
Last quarter we discussed the rising demand for copper as a raw material needed for EVs, EV charging stations, transmission lines and other uses. Silver demand caught our eye this quarter because new data was released showing solar panel manufacturing accounts for roughly 5,000 tons of demand per year (14% of total global demand)! Again, this underscores the need to source these materials ethically and in an environmentally responsible way.
Silver on the Sun
Photovoltaic manufacturing now consumes 14% of global silver supply
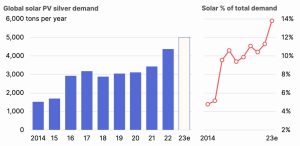
Source: Nat Bullard, Bloomberg NEF
Market Update
We continue to see great investment opportunities in energy storage across the USA. During the quarter, Fund III took steps to expand its potential energy storage capacity by as much as 76 MW across 16 new projects located in the New York City area, nearly doubling the megawatts we already had under development. These steps were taken in response to development work, negotiations with landowners and favorable interconnection study results. Further, several of these projects are expected to benefit from the local utility’s “dynamic load management” program which incentivizes energy assets that can rapidly respond to grid congestion or imbalance, such as distribution-connected batteries.
Nationally, there are now 27 states that have policies supporting the creation of energy storage systems, ranging from direct incentives and installation targets to supporting demonstration projects within the state.
27 States with Energy Storage Policies
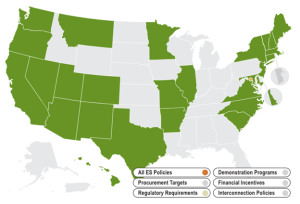
Source and interactive map: https://energystorage.pnnl.gov/regulatoryactivities.asp
Energy Storage Procurement Targets. So far 10 states have passed procurement requirements, generally meaning local utilities must have at least a certain amount of MWs of installed energy storage capacity by a target date (see summary below). These policies are reminiscent of the Renewable Portfolio Standards (RPS) created by 38 states from roughly 1997-2010, which were effective in spurring the development of wind and solar power (and other related assets) across the USA. In the new requirements, storage often is meant to come in the form of battery installations but may also come in the form of pumped hydro, flywheel or other means of storing energy. Some of the policies were made as amendments to existing RPS policies, while others are simply stand-alone measures.
State Targets:
- California—Target of 1,825 MW of storage by 2020
- Connecticut—300 MW by 2024, 650 MW by 2027 and 1,000 MW by 2030 Illinois—Targets for larger utilities are being developed with goals to be met by 2032 Maine—300 MW by 2025 and 400 MW by 2030
- Massachusetts—1,000 MW by 2025
- Nevada—1,000 MW by 2030
- New Jersey—2,000 MW by 2030
- New York—3,000 MW by 2030 (efforts are underway to potentially double this to 6,000 MW)
- Oregon—5 MW by 2020
- Virginia—3,100MW by 2035
North Sky is actively pursuing investment opportunities in several of these states.
RNG ITC Milestone. In January 2024, our Fund III’s Rhode Island project closed one of the first investment tax credit (ITC) transfers relating to a renewable natural gas (RNG) project in the U.S. The project monetized $15.6 million of ITCs in a transaction with a large institutional buyer. The project is producing RNG from organic food waste, which is then sold to Irving Oil as a carbon negative fuel for use in its operations.
Data Centers. Many of the policies discussed above provide direct subsidies or tax credits, which are typically additive to the incentives offered under the federal Inflation Reduction Act. Such state and federal incentives accelerate the construction of the infrastructure that is necessary to continue to add renewables onto the grid and to meet the growing electricity demand caused by (a) the transition away from fossil fuels and toward electricity for heating/cooling and transportation and (b) cryptominers and (c) data centers.
The growing demand from data centers is especially notable, as they are big energy consumers. Like it or not, Artificial Intelligence (AI) is seeping into every aspect of our lives—even in our sustainable infrastructure corner of the world! Great things will happen through AI but there are clearly concerns. As AI becomes ubiquitous, the demand for electricity by the data centers that supply the necessary computing power is expected to increase markedly. McKinsey and Company projects electricity demand from data centers will grow from 19 GW in 2023 to 32 GW by 2029, a 68% increase in demand.
Electricity Demand from Data Centers (in GW)
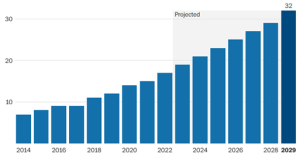
Source: McKinsey and Company, January 2023 (data) and Washington Post (graph).
Boston Consulting Group offers another angle. It says that US data centers used 2.5% of all domestic electricity in 2022 but that demand will triple to 7.5% by 2030. Clearly, this poses a challenge. Big Tech is aware of this, with Google, Amazon, Meta, Microsoft, Apple, cryptominers and others all scrambling to secure new data centers and the power, water and data and transmission lines required to run them. Thankfully, much of the newer power being supplied comes from solar, wind and hydro sources. We see opportunity in providing power to such data centers, as well as new solutions like energy storage to help manage the load.
Infocast Conference. We recently attended the sold out Infocast conference in San Diego. This conference and the RE+ conference are the two primary renewable energy conferences to attend each year. Key takeaways were:
Storage:
- As mentioned above, there are now 10 states with storage procurement targets and incentives for the construction of stand-alone storage for grid stability, demand response and peak load shaving, as well as for the construction of storage alongside new renewable projects (typically wind or solar). Some states are also now incentivizing the addition of storage to existing renewable power systems.
- Within the Electric Reliability Council of Texas (ERCOT) region, the construction of wind and solar projects that have accompanying storage is happening at a furious pace. However, surprisingly few stand-alone storage projects are being built despite a recent large reduction in the cost of batteries (see our Q1 2023 and Q4 2022 market commentary for more on this). The problem in Texas seems to be mostly due to lower profitability than expected just a year ago. Revenue has been low due to a smaller than predicted spread between peak and off-peak electricity prices. Previously planned storage projects intended to exploit that gap by storing power during off peak times and dispatching power at peak times. Other contributing factors are generally higher labor and debt costs and delays in the construction of some big data centers.
California Community Solar Setback:
- The California Public Utilities Commission (PUC), siding with the state’s three public utilities, struck down a program supported by the California legislature that was expected to jumpstart the community solar market, stating the provision to allow renters to participate violated federal law. Proponents of the community solar program were “gobsmacked,” according to one Infocast attendee. The proposal had been modeled after the highly successful NY community solar program, which has resulted in the creation of over 2 GW of community solar projects as of yearend 2023. This seems like a turf war between the legislature and the PUC that needs to be resolved before any program can move forward in California.
- Many development companies had expended significant capital to secure land rights and scout for interconnection sites in anticipation of the community solar program being implemented. Losses are mounting and these developers are in limbo.
Election Year:
- In case you had not heard, this is a Presidential election year. If Biden wins, the status quo seems likely for the IRA and related policies. If Trump wins, we expect no major changes to the IRA other than the possible elimination of EV subsidies and a reduction of the DOE’s loan program relating to energy transition.
Tax Credits:
- Conference attendees were abuzz that qualifying tax credits under the IRA could be transferred even more favorably than previously thought. Apparently, tax credit transfers from the owner of a qualifying project to a third party can now be done based on the higher of cost basis or fair market value at the time of transfer. Previously the calculation was solely on the cost basis, which is typically much lower than a spinning asset’s fair market value. We expect this will immediately benefit North Sky’s infrastructure funds.
Nukes?:
- There were credible discussions about small modular reactors (SMRs) being used for specific new builds with high energy demands, such as data centers. Significant technological and safety advancements have been made since the Chernobyl disaster in 1986. SMRs are often meant to be 300 MW or smaller and are viewed by many to be much cheaper and safer than the larger (e.g., 1 GW) light water reactors that have been built over the last 70 years. Nuclear power provides reliable, carbon-free, baseload power but comes with both real and perceived negative impacts. TerraPower believes next-gen nuclear power designs can overcome the negatives and plans to build a nuclear power plant in Wyoming starting in June. The plant will produce 345 MW of baseline power and use molten salt as an energy storage system, which will enable the plant to boost output to 500 MW for approximately five hours at a time to meet peak demands. As an aside, Clean Growth V has an investment in EnergySolutions, which would benefit from any development of new SMRs (it safely disposes of low level waste streams from nuclear power plants and assists with the decommissioning of old plants). It is unlikely that a new nuclear design, let alone the accompanying indemnification requirements, would be suitable for our current infrastructure funds.
We are actively putting Clean Growth VI to work, and we believe the investment environment is very favorable. CG VI has approximately $144 million committed to 14 investments. We have an early look at Q4 data and are expecting valuations will be up modestly across the portfolio. CG VI has had two material liquidity events (an energy storage company and an engineering company) and a third is pending (the sale of a logistics technology company). Recent new investments span cleantech, circular economy, education and healthy living & aging. We continue to see a wide variety of opportunities by stage, sector, geography and structure (LP secondaries, preferred equity and single- and multi-asset continuation vehicles). Currently, we are seeing the best opportunities in cleantech and circular economy in both single- and multi-asset continuation vehicles (CVs). Specific portfolio highlights include methane capture, smart meters, green hydrogen, heat pumps and other exciting growth areas. In contrast, we are not seeing that many actionable opportunities in the AgTech sector, but this is an ever-changing marketplace where opportunities rotate based on economic, technological, consumer-preferences and other factors.
We believe secondaries remains one of the most favorable impact investing opportunities in the private markets. Despite a dramatic increase in primary fundraising for impact strategies in recent years, capital allocated to impact secondaries has not kept pace. Institutional investors are still waiting for M&A and IPO exits (liquidity) from much of their existing PE holdings, so are continuing to sell assets on the secondary market. As a result, we believe buyers of impact secondaries like us continue to hold an advantage in negotiations, which we have been able to convert into highly discounted and/or attractive entry points to a diversified portfolio of impact assets.
CV Opportunities. For the past several quarters we have been telling LPs that we believe continuation vehicles are particularly attractive, due largely to their risk-return profile. CVs often are “hand-picked” by GPs because the GP believes there is substantial upside if the holding period is extended, the GP knows the management team well and risks have been previously mitigated. The GP sees additional value in that company or group of companies and wants to, in essence, buy it again. In other words, there is a positive selection bias associated with CVs. Not only have these assets been de-risked, but the majority of these companies are cash flow positive which is in contrast to the venture and growth orientation of the majority of newly formed impact funds.
Evercore recently started to track CV performance and the early results support our thesis. Evercore’s data is derived from 140 continuation fund vehicles formed between 2018-2022 and is shown below (as of 9/30/23).

Source: HEC “Continuation Funds Performance and determinants White Paper, March 2024
Key preliminary findings per Evercore:
- Average [Total Value to Paid In capital] for [Single Asset Continuation Vehicles] are slightly higher than [Multi-Asset Continuation Vehicles], which is in line with the higher risk premium associated with underwriting concentration in SACVs.
- Average TVPIs across CV size, geography and sector do not differ statistically.
- No meaningful patterns have emerged for [Distributions to Paid In capital], although…one would think the MACVs are likely to generate DPI sooner than SACVs.
North Sky’s additional commentary:
- We place only modest value in the 2018-20 data given the low number of data points.
- IRRs, while impressive in magnitude, aren’t yet very meaningful given the recency of investments and the outsized effects structuring (such as deferred payments) can have on IRRs of new investments. More data points and the passage of time will be helpful.
We believe TVPI is a better gauge of early performance. It is an easier metric to track an investment’s progress toward your return expectations. We also believe that the TVPI during the first two quarters of ownership helps verify whether you truly invested at a discount to NAV or if that was just window dressing to make the investment look more attractive.
Water Opportunities. We regularly see investment opportunities in water desalination, wastewater treatment, re-use/recovery and water remediation. Recently, we’ve seen the greatest focus on water remediation and re-use/recovery. Both make sense for different reasons. Water remediation, specifically removing PFAS (aka forever chemicals) from industrial wastewater is a multi-billion dollar opportunity that has been highly publicized and in need of new technologies and solutions. As such, it has garnered significant venture investment dollars in recent years. Water re-use/recovery on the other hand is critical to the development of sustainable cities, which increasingly is occurring in certain arid geographies (e.g., the US Southwest). Here we have been finding an increasing number of compelling investment opportunities that requires knowledge of the various available solutions such as desalination, direct air to water conversion (i.e., dehumidifying at scale) and transfer of water from water rich areas to those in need. The latter solution is rarely of interest to us but one we are exploring in earnest today.
Our initial research indicates long-term water purchases and compensatory programs that encourage the reallocation of water to higher uses is the most cost-effective solution to address a water shortage in the US Southwest that is estimated to be 2-4 million acre feet per year. For comparison purposes, the 1922 Colorado River Compact assumed average flows of 18 million acre feet per year. Since 2000, the river’s average flow has been 12.3 million acre feet. The region has effectively compensated for this deficit by drawing down on the country’s largest reservoirs to dangerously low levels, which threatens the growth of Southwestern cities and the hydropower needed to run them. While the “numbers” tell a compelling story, converting a thesis to a successful investment outcome has been more difficult in water than other investable areas. It requires simultaneous support from local communities, local water districts, state water boards and federal agencies that each move at their own pace. We are doing another deep dive in this area and look forward to reporting the results of our efforts soon.