Introduction
This was easily our most active year ever and our most satisfying year on several fronts, including the impact our investments have had. Throughout 2021, we continued to add to our team including Angie Wood (CFO), Dale Freudenberger (Operating Partner, Infrastructure), Lucy Fan (Principal, Infrastructure), Nate Condon (Senior Associate, Secondaries), Rachael Polson (Marketing Associate), Ingrid Michalski (Fund Operations Analyst) and Monica Ravi (Associate, Secondaries). We upgraded our Boston office and re-opened our NYC office, which had closed due to covid rules. We made important and highly-impactful investments in areas like renewable natural gas (Project Golden Bear), community solar (Project North Farm) and healthcare (10K Lakes/Medable). We had so many successful private equity exits it was hard to pick just a handful for the “highlight reel” but here it is: Zevia (IPO), Cnano (proceeds distributed after Chinese IPO last year), Lucid (IPO), Coinbase (IPO), Hims & Hers Health (IPO), ZipRecruiter (IPO), STEM (SPAC), Sonendo (IPO), Summit Veterinary Pharmacy (sold), Enovix (SPAC), Scodix (IPO), US Water Filters (sold), BrightFarms (sold), Enbala (sold) and Objective (sold). We also exited triple bottom line infrastructure investments from our prior Sustainable Infrastructure Funds, including US Solar, Project Rooftop (solar), and likely Project Empire (solar) as of this writing. Using federal tax credits, we made investments in low income areas around the USA to spur economic development, including the construction of a peanut shelling plant for rural farmers that recently became operational.
We will continue to strive to do work worth doing. We will finish the year strong with two additional investments.
Market Update
Sustainable Infrastructure
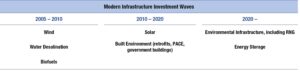
Landfill gas investment opportunities. We see a very large opportunity to invest in renewable natural gas (“RNG”). There have been three phases of sustainable infrastructure investing during this century. The first phase was led by new investments in wind, biofuels and water desalination assets. The second phase was led by new solar power assets and improvements to our built environment, such as retrofitting incandescent lighting to LEDs and installing more efficient HVAC systems and better insulation (often with low/no VOCs and much higher R-factors). We are in the third phase now and it is currently led by environmental infrastructure such as RNG facilities, other waste to value or waste to energy projects and energy storage.
There are three main forms of RNG: municipal wastewater methane, landfill gas and agricultural or food waste gas. We covered wastewater methane last quarter so let’s now discuss the landfill gas opportunity. Estimates for the number of active landfills in the United States range from 1,250 to more than 3,000, and there are more than 10,000 capped or closed landfills nationally.1 The United States produces at least 63.1 million tons of food waste annually and 35.3 million tons of this ended up in landfills in 2018: food waste represents an estimated 21% of overall landfill composition.2 Additionally, the number of active landfills accepting new waste is consolidating as compliance requirements prevent new landfills from opening. As a result, existing landfills are both growing larger and more capacity constrained.3
Food waste and other forms of organic material decompose and slowly produce methane over decades. When organic material is placed in landfills, that methane can accumulate and combust under pressure, which is why modern landfills typically utilize means to release the methane from the landfill before that happens. Landfill methane accounted for 15% of overall US methane emissions in 2019, equivalent to releasing 114.5 million tons of CO2 into the atmosphere.4 The EPA’s Landfill Methane Outreach Program tracks data on 2,600 landfills in the US of which only 500 so far capture and reuse that methane. The other landfills likely allow the methane to enter the atmosphere or flare the gas onsite. Importantly, the EPA has already identified another 481 of those 2,600 sites that are well suited for landfill gas project development.5 If on average, the equity check North Sky would write for each of those sites was $10-15 million, that represents a $4.8-7.2 billion near-term opportunity set just for landfill gas.
Methane gas captured from landfills can be used in a variety of ways, including (i) to generate onsite thermal and electrical energy for a local commercial or industrial offtaker (a “medium” btu project), (ii) to power a reciprocating engine to create renewable electricity for the local power grid (also a “medium” btu project) or (iii) injected into a natural gas pipeline as renewable gas (a “high” btu project). North Sky is well positioned to capitalize on landfill gas opportunities due to our track record in building and owning similar projects, and we have an extensive network of landfill gas-to-energy developers and operators. Of the waste-to-energy sectors, landfill gas-to-energy projects are already the most widely deployed and proven. In addition to the 481 de novo projects mentioned above, there are also investment opportunities to redevelop existing landfill gas sites to higher beneficial uses, such as improving the efficiency of the old equipment or decreasing the carbon intensity of existing sites by adding solar power and battery storage system. We are intending to add solar and storage in the next phase of one of our California RNG sites.
To give a specific example, our first landfill gas project was the LRI Landfill near Tacoma, Washington in 2013. That project captures and utilizes about 874,000 mmbtu of landfill waste methane per annum, equivalent to preventing 4,624 metric tons of CO2 from being released into the atmosphere, removing 1,000 cars from the road or planting 76,000 trees.6 It utilized this gas to produce 5 MW of clean electricity, enough to power at least 2,000 homes.7
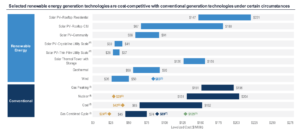
Price comparison of various energy sources. For experienced renewable energy investors, the chart by Lazard below will be familiar. It compares the cost to generate 1,000 watt hours of electricity by various means. This chart, updated as of late October 2021, shows for example that the low end of the cost range for coal fired electricity is $65 per thousand watt hours—or said in a manner most of us are accustomed, 6.5 cents per kilowatt hour. Similarly, the low end of the cost range for natural gas fired electricity (see Gas Combined Cycle) is 4.5 cents per kilowatt hour. One important takeaway is that it is typically cheaper to build new utility scale solar and wind power producing assets than it is to construct new coal or gas plants. Perhaps the most interesting observation though is that it is cheaper to build new utility scale solar and wind assets than it is to merely maintain and operate a fully-depreciated coal plant—see the gold diamond in the coal row ($42) and footnote 5. Renewables are on the verge of overtaking nuclear and gas plants in the same way. We are living in the age of renewables.
Levelized Cost of Energy Comparison—Unsubsidized Analysis
Federal infrastructure activity. For several quarters we have been commenting on the sausage making in Washington, D.C., including the $1.75 trillion+ Build Back Better Act for several quarters. This Act passed the House on November 19 but now appears dead in the Senate, at least in its current form.
Impact Secondaries
Climatech and agtech. Our impact secondaries team was very busy in the back half of 2021. We focus on four areas:
• Cleantech / climatech
• Sustainable food & ag
• Waste & water
• Healthcare
Below is fundraising data for two of those areas—specifically climatech and agtech funds raised from 2005 through the first half of 2021. Note the 2021 data is extrapolated for a full year based on data from the first half of the year. The chart shows the ebbs and flows of capital for these two sectors—generally $7-12 billion has been raised each year with outliers in 2017 (more than $15 billion) and again in 2020 (more than $17 billion).
Global Climatech & Agtech VC Fundraising
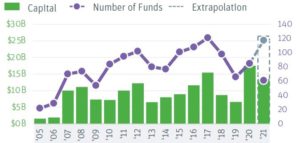
If the second half of 2021 comes in as strong as the first half, fundraising may exceed $25 billion for climatech and agtech funds. Pitchbook is reporting that venture funding for agtech companies was $3.2 billion in Q3—a record. We are not surprised. Investment dollars are flowing into indoor agriculture and related technology (sometimes called “controlled environment agriculture”), crop productivity technology like plant seed tech, drone or satellite imaging, soil testing and analysis, robotic assistance and biologicals that are alternatives to fertilizer. We are currently reviewing several opportunities in sustainable food and agriculture, including one portfolio with plant seed, imaging and biological tech, but we are being a little cautious regarding capital-intensive indoor ag companies. Indoor ag is appealing on its face, but we are reaching the shakeout phase of this trend. Indoor ag reduces or eliminates the need for pesticides, reduces water usage, can be done close to end markets and is generally not subject to drought and other weather events that may decrease yield. However, indoor ag can be very capital intensive at the outset—building construction costs, lighting, automation, heating/cooling systems, transportation infrastructure to get your product to buyers, etc. Also, competition is heating up and a few bigger players are emerging. Differentiators will be access to cheap capital, capable management teams that can deliver growth and near-term profitability and the best combination of technology (lighting, automation/robotics, safeguards against pests and disease, water access and purification, waste control, use of renewable energy and others).
But in toto, the new funds being formed in climatech and agtech in recent years is exciting news as it shows the market is large and growing for these two impact sectors. We expect a long tail of secondary investment opportunities that will benefit our funds for years to come.
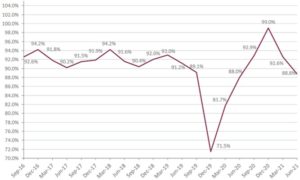
Secondary pricing fell. Pricing based on June 30, 2021 net asset value (NAV) was 88.8%, according to PEFOX. Average secondaries pricing over the last 20 quarters was 90.4% of NAV. It was 91.0% if you throw out the high and the low from the data set. So the latest datapoint is below average. Surely there have been some wild swings in pricing since covid emerged. Based upon the last two data points it looks like we may be settling back into a normal range; however there is clearly another factor at play in this latest reading. The public equity markets have run up significantly post-covid and private equity valuations have run up too. There is a general sense in the traditional secondaries market that valuations are pretty full. For traditional secondaries funds to buy anew, they need a steeper discount to hit their targeted returns.
PEFOX Average Secondary Pricing
All that said, we are not experiencing these extremes in our little corner of the marketplace—impact secondaries—but the market psychology is still instructive. As said previously, we are still seeing big discounts in our traditional secondaries purchases in our four impact sectors (31% on average in our most recent fund) and are often the only bidder thanks to our proprietary sourcing efforts. The frenzy of the broader secondary market is not directly at play within our investment strategy.
Conclusion
We have a lot to be grateful for—and we are grateful—here at North Sky. For reasons stated above and in other recent commentaries, there are bountiful investment opportunities for experienced impact investors like us. We are going to carry our high energy level into next year and keep pressing our advantage. We wish you a (belated) happy Hannukah, a very merry Christmas and a prosperous and healthy New Year!